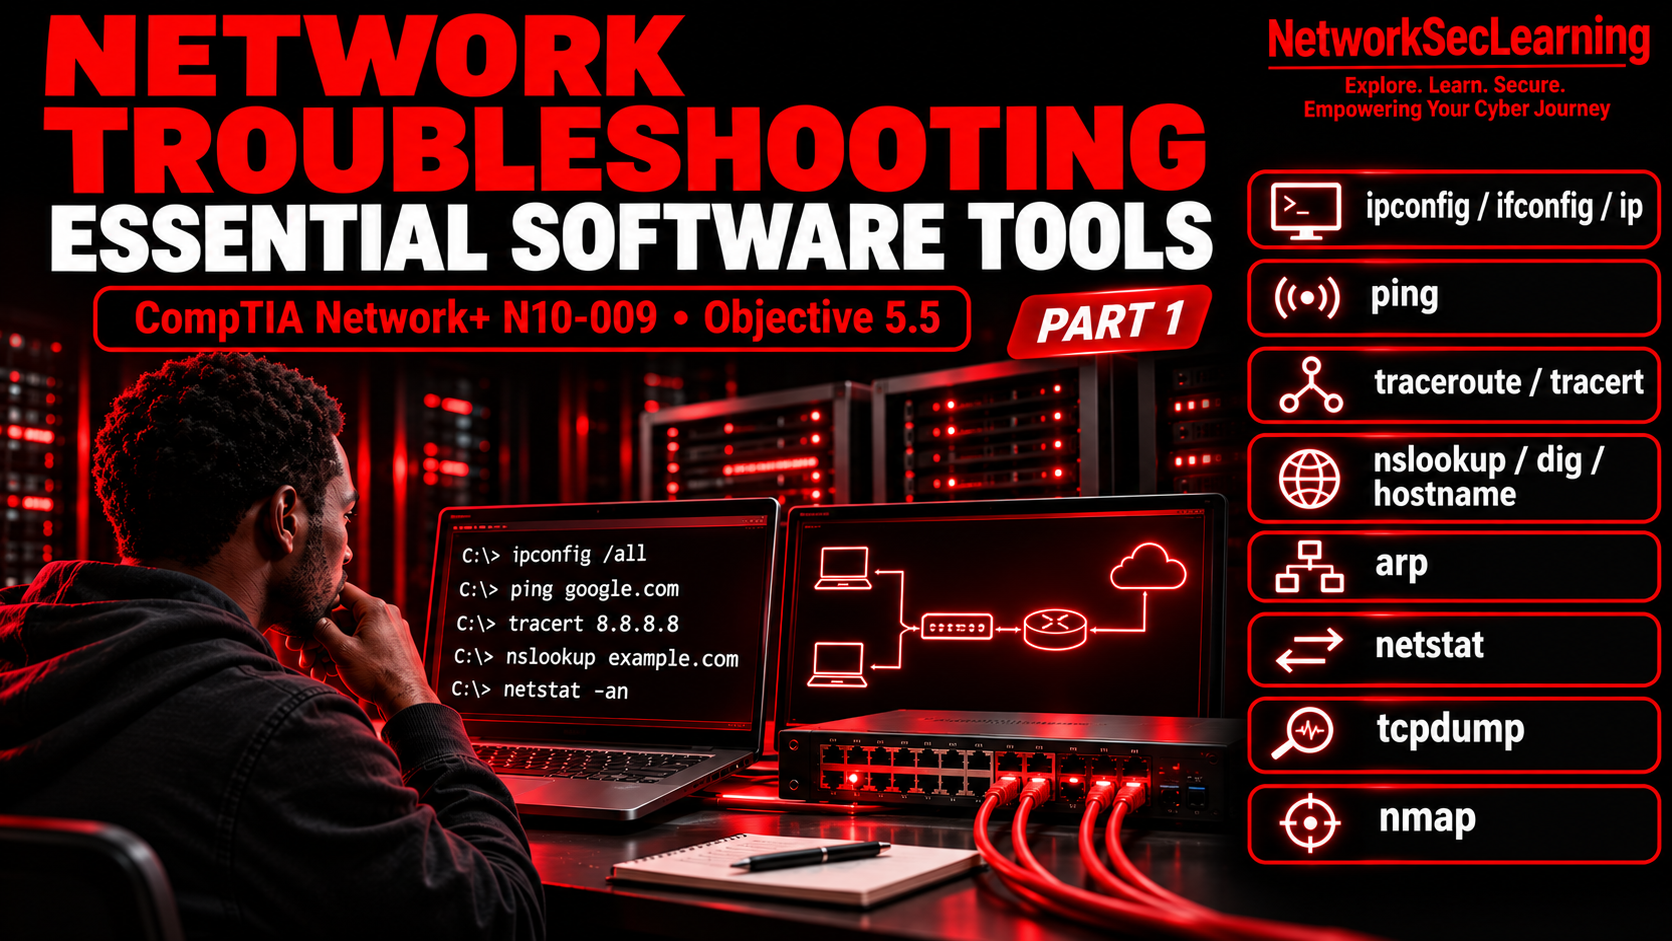
Welcome dear NetworkSecLearners to this new tutorial in which we are going to explore the essential Software Tools used for Computers Networks Troubleshooting. 😊
If you have read my previous article on the Network Troubleshooting Methodology, you now know the seven steps to follow when something goes wrong on a Computer Network. But knowing the steps is only half the job. You also need to know which tools to use at each step. And that is exactly what we are going to cover today.
This article is directly related to CompTIA Network+ exam objective 5.5 which is “Given a scenario, use the appropriate tool or protocol to solve networking issues”. As you may remember from the previous article, Domain 5 Network Troubleshooting covers 24% of the exam which is the highest percentage. So once again, this article is gold for you if you are preparing the CompTIA Network+ certificate. 😉
Now, objective 5.5 covers both Software Tools and Hardware Tools. Since there is a lot of ground to cover, I decided to split this into two articles. Today, we will focus on the Software Tools and command-line utilities that you will use the most in your daily work. In the next article, we will cover the Hardware Tools such as cable testers, multimeters, TDRs and the Network Device Commands like show interface, show config and show route.
Well, enough talking, get ready and let’s get started with the first tool which is probably the one you will use the most. 😉
1. Tool n°1 : ipconfig, ifconfig and ip
Before you can troubleshoot anything on a Network, you need to know your own configuration first. What is your IP address ? What is your default gateway ? Are you getting your address from DHCP or is it static ? These are the first questions you need to answer and these three commands give you exactly that.
1.1 ipconfig (Windows)
If you are on Windows, ipconfig is your main command and you just have to open a Command Prompt and type ipconfig and you will see your IP address, subnet mask and default gateway for each Network interface.
But the real power comes with the options :
ipconfig /all gives you the full picture including your MAC address, DHCP server, DNS server, lease times and whether DHCP is enabled. This is the command we use the most when we start troubleshooting a Network issue on a Windows machine.
ipconfig /release releases your current DHCP-assigned IP address.
ipconfig /renew requests a new one from the DHCP server.
These two previous commands are extremely useful when a machine has a bad IP address or when you suspect a DHCP issue.
1.2 ifconfig (Linux / macOS)
If you are on Linux or macOS, the equivalent command is ifconfig. It displays the status of your currently active Network interfaces including IP address, MAC address, MTU and packet statistics.
ifconfig -a shows all interfaces including the inactive ones. You can also use ifconfig [interface] down and ifconfig [interface] up to disable and enable a specific interface.
However, you should know that ifconfig is now deprecated on most modern Linux distributions.
1.3 ip (Modern Linux)
The modern replacement for ifconfig is the ip command. It does everything ifconfig does and more.
ip a displays all interface configuration information.
ip a add [ip_address] dev [device] assigns a static IP address to an interface.
ip link set dev [device] down and ip link set dev [device] up disable and enable an interface.
One interesting capability of the ip command is that it can change the MAC address of an interface using ip link set dev [device] address [MAC_address]. This is called MAC spoofing and while it has legitimate uses in testing, it is also a technique used by Attackers which is why it is important to know it exists.
And now comes the 1 million question which is where or basically at which step you can use these tools.😉Have you guessed the answer? If no, well, it is Step 1 of the Troubleshooting Methodology (Identify the Problem). Before doing anything else, you have to check your own Network configuration using these tools and you might be surprised how many issues come down to a wrong IP address, a missing default gateway or a machine that did not get its DHCP lease.
2. Tool n°2 : ping
Ping does one simple thing which is to send a small packet to a destination and waits for a response. If you get a response, there is connectivity and if you don’t, it means something is blocking the communication.
On Windows, ping google.com command sends four packets by default. On Linux and macOS, it runs continuously until you press Ctrl+C. You can use ping -n [number] on Windows or ping -c [count] on Linux to specify how many packets to send. And ping -t on Windows sends packets continuously which is useful when you want to monitor a connection over time.
For IPv6, use ping -6 [destination].
But ping is not just about typing a command and seeing if it works. There is a systematic way to use it that directly follows the Troubleshooting Methodology and here is the approach I recommend :
First, ping a well-known external website like google.com. If it works, your Network and Internet connection are fine and the problem is probably somewhere else like DNS or a specific application.
If that fails, ping a known external IP address like 8.8.8.8. If this works but pinging google.com did not, the problem is DNS and not connectivity. If that also fails, ping your default gateway. If your gateway does not respond, the issue is on your local Network. And if even your own IP address does not respond to a ping, check your Network card and its drivers because the problem is on your machine itself.
And here these commands are to be used for step 3 of the Troubleshooting Methodology (Test the Theory). ping helps you confirm or deny your theory about where the problem is located.
3. traceroute / tracert
Ping command tells you if you can reach a destination whereas traceroute tells you how you get there and where it breaks along the way.
On Windows, the command is tracert [destination]. On Linux and macOS, it is traceroute [destination]. For IPv6, use traceroute -6 [destination].
What traceroute does is display every router and firewall between your machine and the destination. Each one of these intermediate devices is called a hop. For each hop, you see the IP address and the response time. It works by using the Time to Live (TTL) field in the IP packet header to identify each hop one by one.
This is incredibly useful because if ping fails, traceroute shows you exactly where the communication stops. Is it your local router ? Is it your ISP ? Is it a router somewhere in between ? This information directly tells you who needs to fix the problem.
One thing to keep in mind : some routers and firewalls are configured to not respond to traceroute packets. When that happens, you will see timeouts (shown as * * *) for those specific hops. This does not necessarily mean there is a problem at that hop. It just means that device chose not to respond.
You can use this command at Step 3 of the Troubleshooting Methodology (Test the Theory). When ping fails and you need to find where exactly the communication breaks down.
4. nslookup, dig and hostname
If you followed the ping approach I described above and found that pinging an IP address works but pinging a domain name does not, the problem is DNS. And the tools you need for DNS troubleshooting are nslookup and dig.
4.1 nslookup
nslookup stands for Name Server Lookup. It queries the DNS system to find the IP address associated with a domain name or vice versa. It works on Windows, Linux and macOS.
nslookup has two modes. In non-interactive mode, you simply type nslookup [domain] and you get the IP address back. In interactive mode, you type nslookup without arguments and you enter a query environment where you can change the DNS server you are querying, search for different record types (A, MX, CNAME, etc.) and perform more advanced lookups.
4.2 dig
dig is the Linux and macOS equivalent. It performs the same function but with more detailed output and it does not have an interactive mode. You specify everything in one command, for example dig google.com MX to look up the mail exchange records for google.com.
4.3 hostname
While we are on the topic of names, the hostname command simply displays the name of your machine on the Network. It works on all platforms. Simple but useful when you are remotely connected to multiple machines and need to confirm which one you are actually on.
You can use this command Step 3 of the Troubleshooting Methodology (Test the Theory). When you suspect a DNS resolution issue.
5. arp
The arp command lets you view and modify the ARP cache on your machine. The ARP cache stores the mapping between IP addresses (Layer 3) and MAC addresses (Layer 2) for devices your machine has recently communicated with.
arp -a displays the entire ARP cache. arp -d [IP] deletes a specific entry. arp -s [IP] [MAC] creates a static entry.
Why is this useful ? If two devices on the same Network have the same IP address (an IP conflict), the ARP cache may contain incorrect mappings. Clearing the ARP cache and letting it rebuild can sometimes resolve communication issues. Also, in a Cybersecurity context, looking at the ARP cache can help detect ARP spoofing attacks where an Attacker sends fake ARP messages to associate their MAC address with someone else’s IP address.
By default, ARP cache entries expire after about 6 hours (21,600 seconds) unless they are set as static.
When to use this tool : Step 3 (Test the Theory) when you suspect Layer 2/Layer 3 mapping issues, or during a security investigation.
6. netstat
netstat stands for Network Statistics. It shows you all the active Network connections on your machine including which local and remote IP addresses are involved, which ports are being used and the current state of each connection.
The basic netstat command gives you a simplified output with four columns : Protocol, Local Address, Foreign Address and State.
The really useful options are :
netstat -a shows all sockets including listening ones.
netstat -n displays IP addresses as numbers instead of resolving them to hostnames which makes the output faster and easier to read.
netstat -an combines both. And netstat -ano adds a fifth column showing the Process ID (PID) that owns each connection.
That last one, netstat -ano is particularly valuable for Cybersecurity. If you see a suspicious connection to an unknown external IP address, the PID tells you which process is responsible. You can then use the tasklist command on Windows to identify exactly which application or service is communicating. This is one of the first techniques used to detect Malware or botnet activity on a compromised machine.
netstat -s displays detailed statistics for all protocols (TCP, UDP, ICMP for both IPv4 and IPv6) which is useful for understanding the overall health of your Network stack.
When to use this tool : Step 1 (Identify the Problem) to understand what connections are active, and Step 3 (Test the Theory) to confirm suspicious Network activity.
7. tcpdump
tcpdump is a command-line tool that captures Network packets in real time and is included by default on Linux and macOS. On Windows, you would need to download it separately.
What makes tcpdump powerful is that it lets you see exactly what is happening on the wire. For each captured packet, you get the timestamp, IP version, source and destination addresses and ports, TCP flags, sequence numbers, acknowledgment numbers and packet length.
tcpdump can display captures in real time on your terminal but more importantly, it can save them to a PCAP file (Packet Capture) for later analysis. This is extremely useful because you can then open that PCAP file in Wireshark which provides a graphical interface for deep packet analysis.
In practice, tcpdump and Wireshark are often used together : tcpdump captures the traffic on a remote server or device and Wireshark analyzes it on your workstation with its powerful filtering and visualization features.
If you have read my article on the 2015 Jeep Hack, you will understand why packet analysis matters. The researchers used similar tools to understand the communication between the Uconnect head unit and the Sprint cellular network. Packet analysis is not just a troubleshooting skill, it is also a fundamental Cybersecurity skill.
When to use this tool : Step 3 (Test the Theory) for deep Network analysis, and in Cybersecurity for traffic analysis, intrusion detection and forensic investigations.
8. nmap
nmap stands for Network Mapper. It is one of the most versatile Network tools available and it is used for host discovery, port scanning, service detection and operating system detection.
With nmap, you can scan a Network to discover which devices are connected, which ports are open on those devices, which services are running behind those ports and even which operating system a device is running.
In a troubleshooting context, nmap is useful for identifying rogue devices connected to your Network, verifying that the correct services are running on a server, or creating a Network map for documentation purposes.
In a Cybersecurity context, nmap is one of the first tools used in the Reconnaissance phase of a Penetration Test. If you have read my article on the MITRE ATT&CK Framework, you will recognize this as the Discovery tactic.
When to use this tool : Step 1 (Identify the Problem) for Network discovery and inventory, and in Cybersecurity for Reconnaissance and security auditing.
Conclusion
Thank you for reading this article till here. 😊
As we have seen, knowing the Troubleshooting Methodology is important but knowing which tool to use at each step is what makes us effective in practice. Let’s do a quick recap of what we covered :
ipconfig / ifconfig / ip : check your own Network configuration (Step 1)
ping : test basic connectivity with a systematic approach (Step 3)
traceroute / tracert : find where the communication breaks (Step 3)
nslookup / dig : troubleshoot DNS issues (Step 3)
arp : inspect Layer 2 / Layer 3 mappings (Step 3)
netstat : see active connections and detect suspicious activity (Steps 1 and 3)
tcpdump : capture and save packets for deep analysis (Step 3)
nmap : discover hosts, ports and services on the Network (Step 1)
My personal advice is not to just read about these tools but to open a terminal right now and try them. Type for instance ipconfig /all or ip a on your machine. Ping your default gateway. Run netstat -ano and see what connections are active. The best way to learn these tools is to use them when nothing is broken so that when something does break, you already know what the normal output looks like. 😊
In the next article, we will cover Part 2 of this objective which will focus on Hardware Tools such as cable testers, TDRs, fiber light meters and spectrum analyzers as well as Network Device Commands like show interface, show config and show route and Discovery Protocols such as LLDP and CDP.
I hope this article helped you understand the essential Software Tools for Network Troubleshooting. As always dear NetworkSecLearners, keep learning, stay curious and stay secure ! 😊
If you enjoyed this article, please share it with someone who is learning Network Troubleshooting, leave a comment below telling me which tool is your favourite or which one you would like a dedicated tutorial on and subscribe to my newsletter so you never miss the next tutorial. 😊
References
1. CompTIA Network+ (N10-009) Exam Objectives. CompTIA. https://www.comptia.org/certifications/network
2. Dion, J. (2024). CompTIA Network+ (N10-009) Study Notes. Dion Training. https://www.diontraining.com